
Your agent has earned trust in shadow mode. Now it runs on its own: an alert fires, the agent starts, investigates and proposes a fix before anyone opens a laptop. Here is what it takes to make that safe, scalable and better every week.
This is the third article in a series on taking an AI SRE agent from a weekend experiment to production. Part 1 built a local, read-only agent on a throwaway cluster and refined it against a synthetic eval set. Part 2 pointed it at real infrastructure in shadow mode and climbed an evidence-gated trust ladder up to approved remediation on non-critical services.
Up to now a human started every investigation. In this part the agent reacts to your alerts automatically. That shift changes the problem. Writing a good prompt matters less; running a system matters more. Alerts arrive in storms, investigations run in parallel, the agent needs credentials, and every change to a prompt or a model can quietly make it worse.
We’ll cover the pieces in the order an alert meets them:
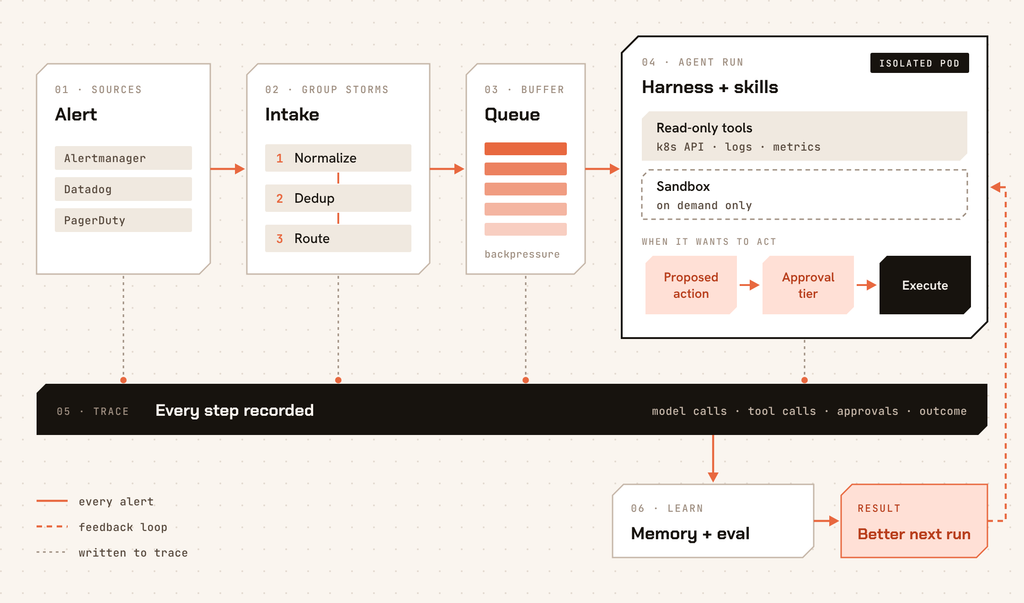
From alert to agent run
Intake: one incident, one investigation
The first thing an autonomous agent meets is noise. A failing node can fire forty alerts in a minute: pod restarts, readiness failures, latency, error rate, all for one root cause. If each alert starts its own investigation you get forty agents reading the same logs, forty Slack threads, and a large model bill.
Put a thin intake layer in front of the agent that does three things:
- Normalize. Every source sends a different payload. Turn each one into one incident shape: source, cluster, namespace, workload, alert name, severity, labels, start time.
- Dedup and group. Fingerprint each alert and group alerts that share a likely cause inside a time window. A new alert that matches an open investigation gets attached to it as extra evidence. It does not start a new run.
- Route. Decide which agent, with which skills, handles this incident. Routing is usually a rule on cluster, namespace or alert type: database alerts go to the agent that knows your database runbooks.
def fingerprint(alert: Incident) -> str:
return f”{alert.cluster}/{alert.namespace}/{alert.workload}”
def on_alert(alert: Incident) -> None:
key = fingerprint(alert)
open_run = runs.find_open(key, within=timedelta(minutes=15))
if open_run:
open_run.attach_evidence(alert)
return
queue.enqueue(route(alert), alert)
Start with a simple fingerprint like the one above and tune it with real data. Grouping too tightly misses storms. Grouping too loosely hides a second, unrelated incident inside the first one.
A queue between alerts and agents
Never call the agent straight from the webhook. Put a queue in between. It gives you:
- Backpressure. A storm fills the queue instead of starting hundreds of pods.
- Concurrency limits. Cap parallel investigations per cluster and per team.
- Retries that end. A run that crashes gets retried a bounded number of times, then goes to a dead-letter queue and alerts a human. A retry loop with no limit turns one bad incident into an outage of the agent.
Budgets on every run
An autonomous agent has no one watching it think, so give every run hard limits: a wall-clock timeout, a maximum number of tool calls, and a token budget. When a limit is hit, the agent posts what it found so far and stops. A partial answer at minute ten is more useful than a perfect one at minute forty, and it keeps a stuck loop from burning money all night.
Running the agent
Pick a harness, keep it thin
The harness is the loop that calls the model, runs tools and manages context. Good options today are the Claude Agent SDK, Google ADK, LangGraph and kagent, a Kubernetes-native framework that defines agents and tools as custom resources.
The harness matters less than you’d think. What you built in Part 1 and Part 2, your skills, your context files and your eval set, is the real asset, and it should move between harnesses unchanged. Keep framework-specific code at the edges so you can switch when a better one ships.
Deploy it like any other workload
The agent is a service that takes work off a queue and makes API calls. Run it the way you run your other services: a Deployment with a pinned image, config from a ConfigMap, health checks, and autoscaling on queue depth. If you use kagent, the agent definition itself lives in the cluster as a resource you manage through GitOps.
Pin everything that changes behavior: the image, the model version, and the version of every skill and prompt. When the agent does something surprising, you need to know exactly what was running.
Isolate it
Security teams worry about two things: data leaving the perimeter, and an agent doing more than it should. You can answer both with tools you already have.
Keep the model in your cloud account. Run the model through Amazon Bedrock (or Vertex AI, or Azure AI Foundry). Requests stay inside your account, IAM controls access, and your existing cloud audit logs record every call. The agent gets access through workload identity (IRSA on EKS) with no API key to leak.
export CLAUDE_CODE_USE_BEDROCK=1
export AWS_REGION=us-east-1
Lock down the pod. The agent is a process in a pod, so harden it like one:
apiVersion: networking.k8s.io/v1
kind: NetworkPolicy
metadata:
name: sre-agent-egress
namespace: sre-agent
spec:
podSelector:
matchLabels:
app: sre-agent
policyTypes: [“Egress”]
egress:
– to:
– ipBlock:
cidr: 10.0.0.0/16
ports:
– port: 443
- Egress allowlist: the model endpoint, the Kubernetes API and your tool gateway. Nothing else.
- Read-only RBAC: a Role with get, list and watch, scoped to the namespaces the agent investigates. A second, narrower Role holds only the specific remediation actions the agent may run after approval.
- Non-root, read-only filesystem: runAsNonRoot: true, readOnlyRootFilesystem: true, allowPrivilegeEscalation: false, all capabilities dropped.
Keep secrets out of the prompt. The agent should never see a raw credential. Route tool calls through a gateway that holds the credentials and injects them on each call. If a prompt injection in a log line convinces the model to print its environment, there is nothing there to print.
When to use a sandbox
Most investigation needs no sandbox. Reading pod status, events, logs and metrics through read-only APIs is safe inside the agent’s own locked-down pod.
Reach for a sandbox when the agent needs to run something:
| Situation | Why a sandbox |
| Running code or scripts the model wrote | You can’t review it before it runs |
| Reproducing a failure (start the image, replay a request) | The workload may be the thing that’s broken |
| Dry-running a fix (apply a manifest to a copy of the namespace) | Proves the change works before a human approves it |
| Parsing untrusted artifacts (core dumps, uploaded files) | Keeps a malicious input away from the agent’s credentials |
The pattern: an ephemeral pod created per task, with no credentials, egress denied, CPU and memory limits, and a short TTL. The agent sends it work, reads the result, and the pod is deleted.
Sandboxes cost startup time, usually seconds. That’s why the default is read-only tools in the long-lived agent, with a sandbox only when the task needs execution. A dry-run in a sandbox is also the best evidence you can attach to a remediation proposal: “I applied this change to a copy and the pods came up healthy” gets approved much faster than “I think this will work.”
Traces are your audit log
Every run should produce a trace: the incident that started it, each model call, each tool call with its input and output, the proposed action, who approved it, and what happened after. OpenTelemetry-based tools like Langfuse or LangSmith capture this with little effort.
That trace is also your audit trail. You don’t need a second logging pipeline. Send traces to write-once storage (S3 with Object Lock, or your SIEM) and keep them as long as your policy requires. A compliance review asks three questions: what did the agent do, who authorized it, and could it have done something it wasn’t allowed to? Each one is a query over the traces, plus the RBAC and NetworkPolicy manifests above.
Where your organization requires change tickets, have the agent open one with its evidence attached and wait for approval before it executes. Its actions then look like every other change in your audit trail.
An agent that learns
A human SRE gets better with every incident. An agent does too, if you build the loop.
Memory
When an incident closes, save what was learned: the symptom, the root cause, the fix, and the evidence that confirmed it. On the next incident the agent searches that memory before it starts from scratch. “The last three times this service threw connection resets, the cause was the connection pool after a deploy” turns a 20-minute investigation into a 2-minute one.
Memory needs care:
- Store evidence along with conclusions. A memory that says “it’s always the connection pool” without the proof behind it turns into a bias.
- Let memories age. Your system changes. A fix from before last quarter’s migration may be wrong today, so recent, confirmed memories should outrank old ones.
- Keep a human in the write path at first. Let engineers confirm or correct the agent’s conclusion when they close the incident, and save the confirmed version.
Feedback at incident close
Your on-call engineers already decide what the real cause was when they resolve an incident. Capture it. A one-click “agent was right / wrong / partly right” plus the actual cause in PagerDuty, Opsgenie or Slack gives you a labeled example for every incident, at no extra cost to the team.
Evals keep it from getting worse
Memory makes the agent better. Evals make sure changes don’t make it worse. Once the agent runs on its own, every change to a prompt, a skill or a model is a production deploy, and it needs a gate.
Grow a golden set from real incidents. Every resolved incident with a confirmed cause becomes a test case: the alert, a snapshot of the evidence, and the right answer. Your set grows every week without anyone curating it by hand.
Score automatically. An LLM-as-judge compares the agent’s root cause with the confirmed one and scores it. Check the judge against human labels on a sample now and then so it stays honest. Langfuse datasets and experiments handle this well.
Gate every change. A new skill version, a prompt edit or a model upgrade runs the full golden set. A scenario that passed before and fails now blocks promotion. This is how you catch “I improved the OOM skill and broke certificate diagnosis.”
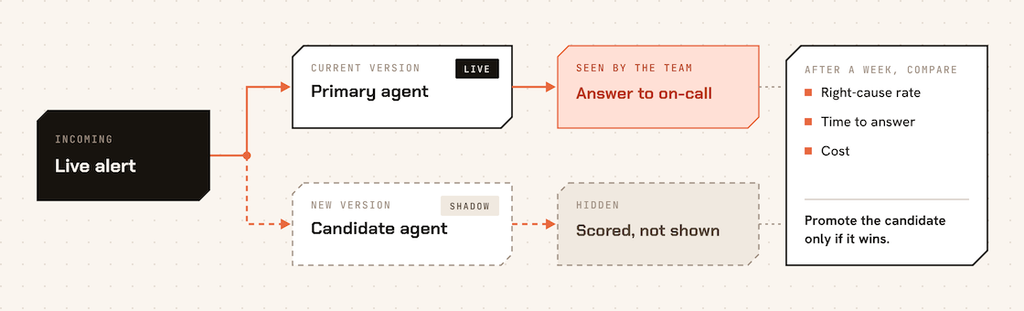
Run a shadow candidate before promoting. The golden set tests the past. To test the present, run the candidate version next to your primary agent on live alerts. Both investigate; only the primary’s answer reaches the team. After a week, compare right-cause rate, time to answer and cost. Promote the candidate only if it wins.
Expanding what it can do on its own
Autonomy grows by action class, and each class earns its place with numbers:
- A track record. At least 50 real incidents of that class, with a right-cause rate above 90% in shadow mode.
- A known blast radius. Restarting one pod in a stateless service is not the same as rolling back a deployment. Start with the smallest.
- A tested rollback. Every autonomous action has a reverse, and that reverse has been run.
Then tier the approvals:
| Tier | Example | Gate |
| 1, low blast radius | Restart a crashed pod in a non-critical service | Execute, then notify |
| 2, medium | Scale a deployment, restart a StatefulSet | Async approval from on-call in Slack or PagerDuty |
| 3, high | Roll back a release, touch a database | Synchronous approval from the service owner |
Moving an action class to a lower tier is a change like any other: it goes through the eval gate and gets reviewed.
Pitfalls
- Alert storms without dedup. Forty runs for one incident. Build intake first.
- Runaway cost. No budgets means one stuck loop at 3am. Cap time, tool calls and tokens on every run.
- Silent regression. A model or prompt change degrades answers and nobody notices for weeks. Pin versions and gate every change on evals.
- Stale memory. Last year’s fix applied to this year’s architecture. Age memories and keep their evidence.
- The agent as fact machine. The on-call stops checking confident answers. Label output as a hypothesis with evidence, and track false positives as a team metric.
Conclusion
You now have an agent that reacts to alerts on its own: intake that turns a storm into one investigation, a queue and budgets that keep it under control, a locked-down runtime with the model inside your cloud, sandboxes when it needs to run code, traces that double as your audit trail, and a learning loop of memory, feedback and evals that makes it better every week.
That is a lot of infrastructure, and most of it has nothing to do with prompts. The teams that succeed with AI SRE spend their time on intake, isolation, evaluation and learning. The model is the easy part.
Coming in Part 4: Everything in this article, running as a service. We’ll walk through the Komodor Agentic Operations Platform in action: an alert arriving and turning into a single investigation, the full trace of the agent’s reasoning, golden scenarios gating every change, a shadow candidate compared against the primary on live traffic, and memory that makes the next incident faster. If you’d rather run the agent than build the platform around it, Part 4 is for you.
Learn how Komodor helps teams to safely accelerate their journey from isolated local agents to enterprise-ready agentic operations.