4 min read The Kubernetes ecosystem is undergoing a significant transformation, as Application Performance Monitoring providers are rapidly shifting their focus to Kubernetes Performance Monitoring. Let's look at the road ahead for Kubernetes Observability.
6 min read This article explains how to handle and prevent Kubernetes networking errors. While some of these issues can be frustrating and time-consuming to troubleshoot, proper handling can significantly reduce system downtime and improve your Kubernetes deployment’s overall performance and reliability.
3 min read We're excited to announce our integration with Cisco Full-Stack Observability (FSO). This collaboration marks a significant milestone in Kubernetes Continuous Reliability, bringing together the best of both worlds to redefine Kubernetes management.
8 min read In this blog, we'll dive into how human error has become a top cause of issues in Kubernetes clusters. We'll analyze the results of key reports, look at specific outage events, and discuss how innovative tools such as Komodor can help solve these problems.
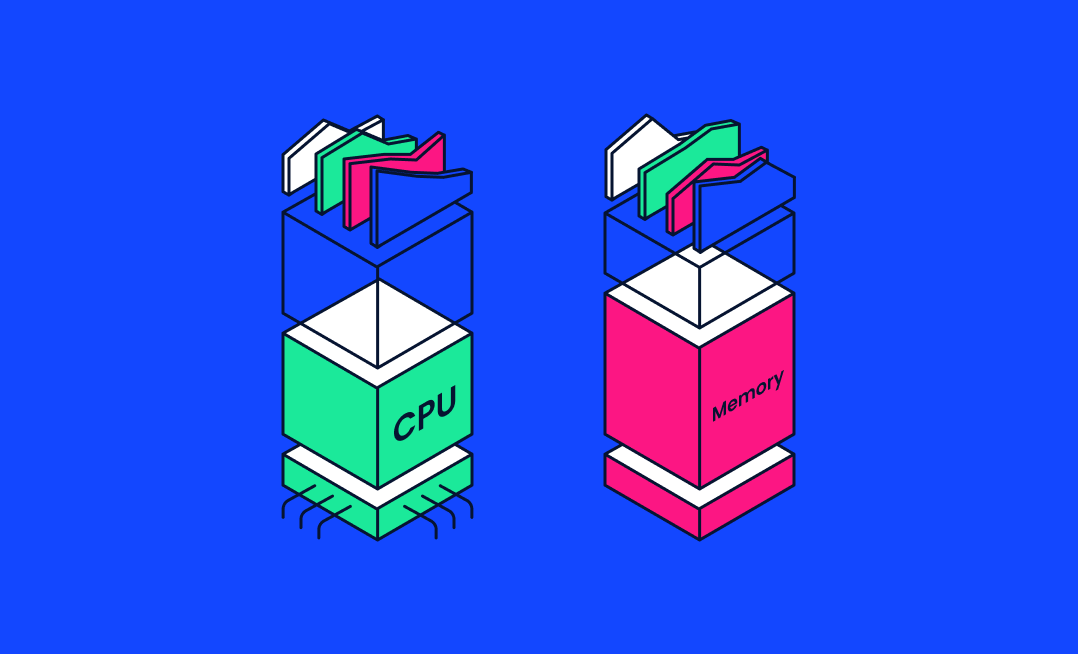
7 min read Resource quotas help your nodes operate in harmony. Setting limits on what they consume means your clusters are more stable and run more efficiently. But getting the values right is the tough part.
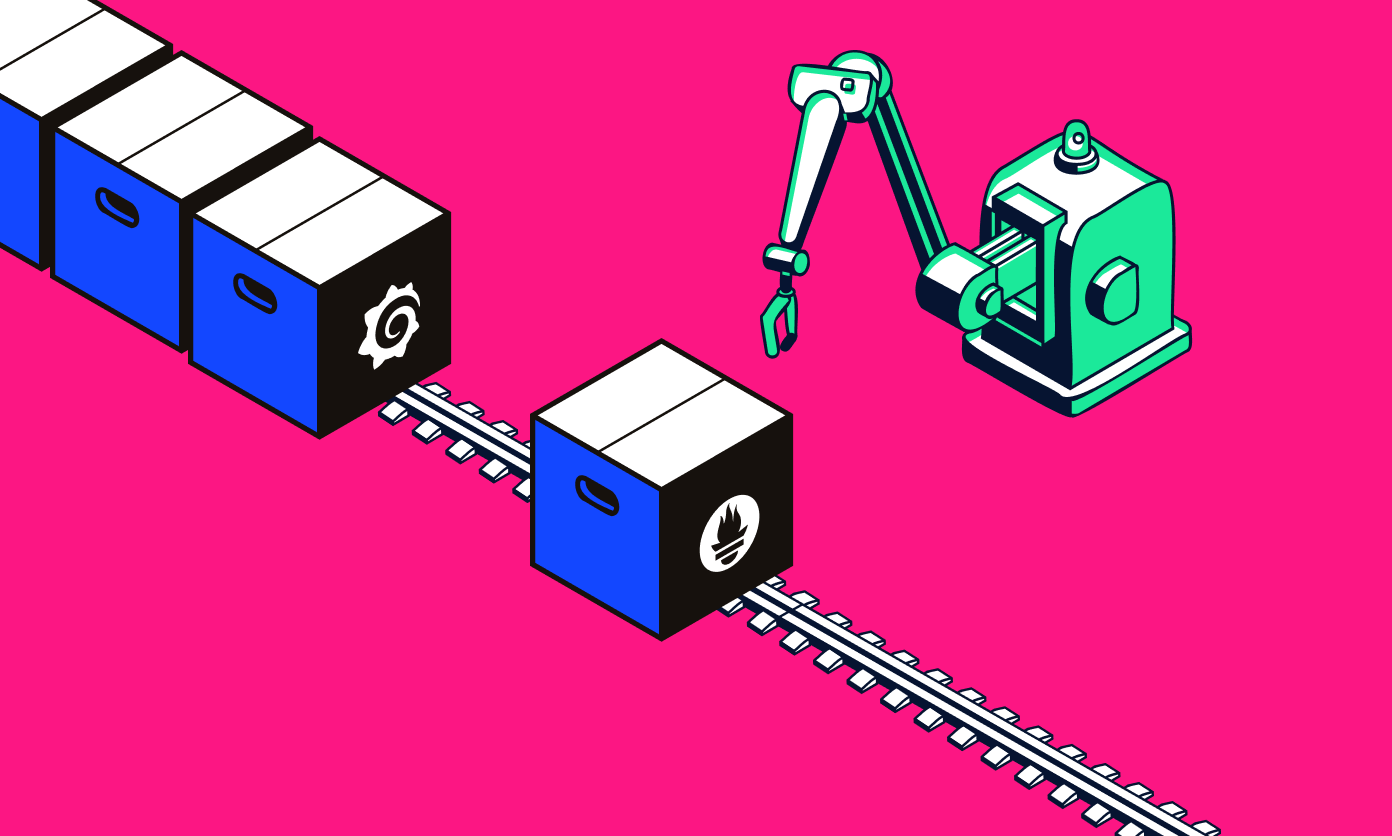
5 min read This post discusses how you can set-up and use Prometheus and Grafana for your metric need
7 min read Recently Komodor was named a Cool Vendor in the Monitoring and Observability category. So why do we feel like a square peg in a round hole?
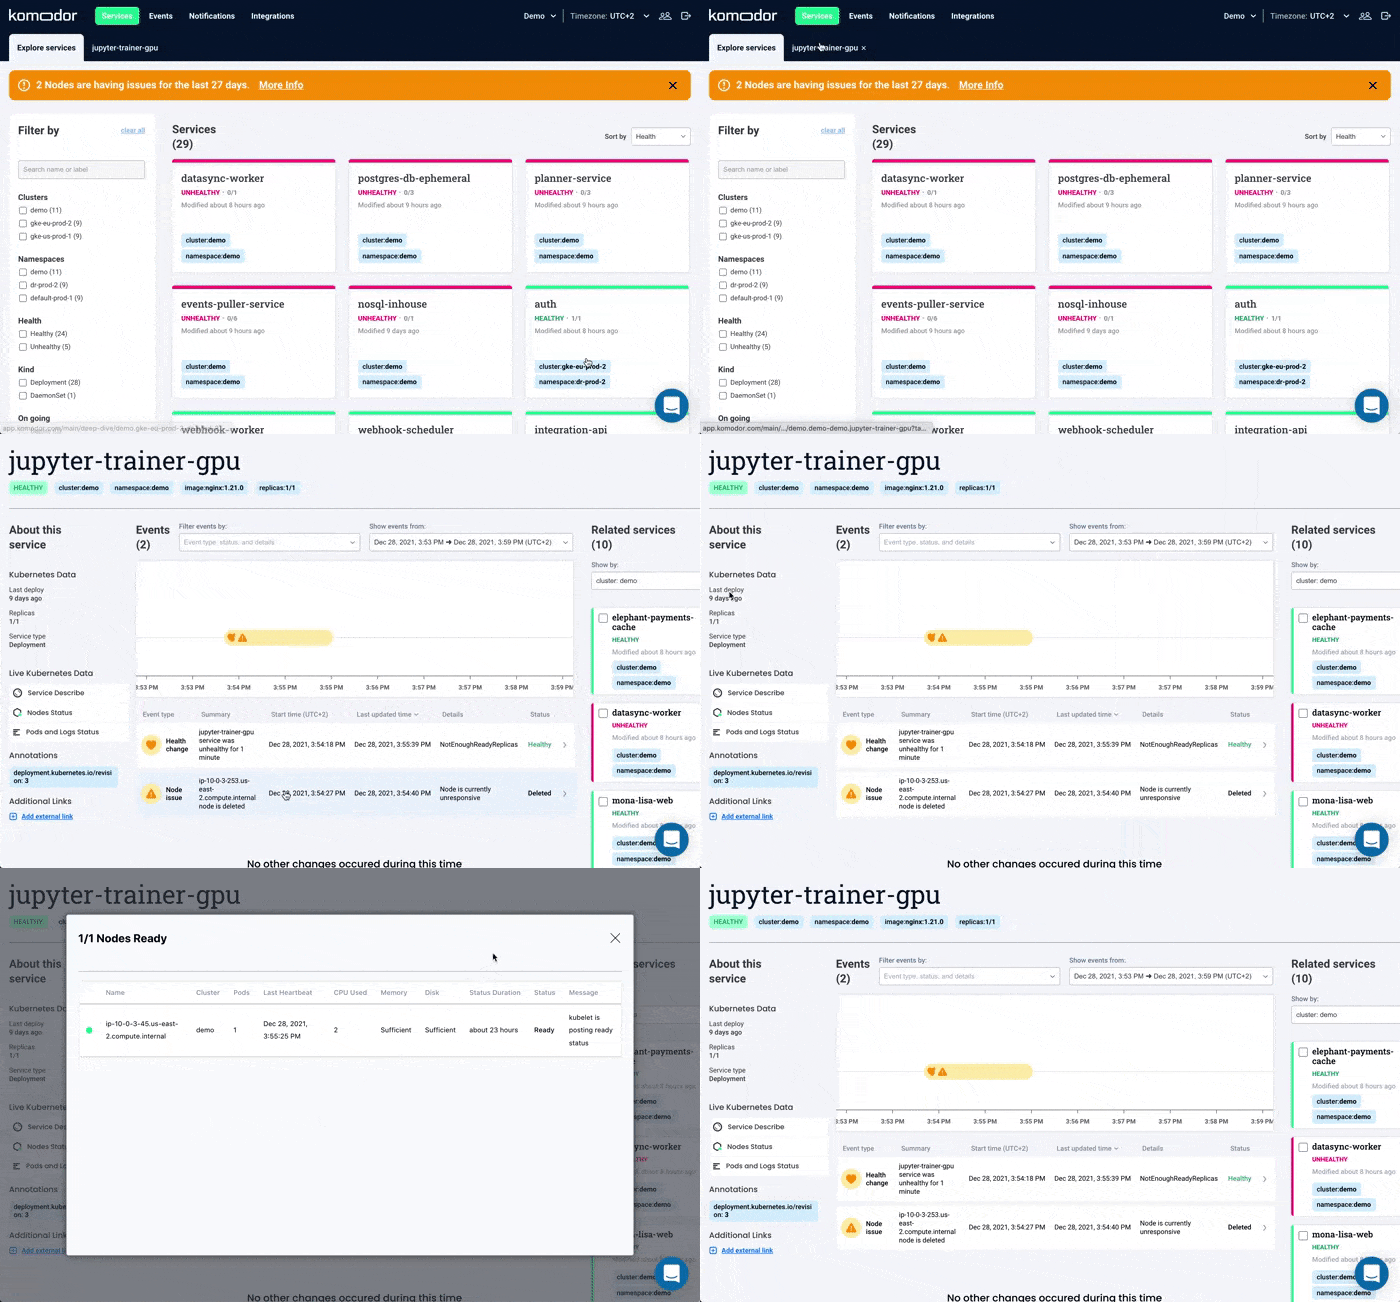
2 min read ‘Node Status’ is our latest feature that easily correlates application-level issues with changes in the node infrastructure.
2 min read Just six months after emerging from stealth Komodor has just been recognized as a Cool Vendor by Gartner!