- Home
- Resource library
- Webinars
- Five Best Practices to Simplify Kubernetes Troubleshooting
Five Best Practices to Simplify Kubernetes Troubleshooting

Mickael Alliel
DevOps Engineer @Komodor
You can also view the full presentation deck here.
Sharon: Good morning, good afternoon, or good evening, depending on where you are in the world. My name is Sharon Florentine. Welcome to today’s webinar, 5 Best Practices to Simplify Kubernetes Troubleshooting. We have an awesome webinar for you today. But before we get started, I need to go through some housekeeping items with you. First, please remember that the session is being recorded. So, if you miss any or all of it, you’ll be able to go back and watch it again. We will send you an email with instructions for how to access the webinar on demand or you can always visit us at devops.com/webinars where it will be there for you as well.
Please use the Q&A tab on your webinar console to submit questions at any time during the presentation. And we will try to get to as many as we can at the end of the webinar. We are doing a drawing at the end today for 4 $25 amazon gift cards. So, stick around and make sure to see if you are a winner. Hopefully, you will make sure that you’re a winner.
Alright. So, I am pleased to introduce to you today, Mikael Alliel. He is a DevOps engineer at Komodor and he’s going to take it away with his presentation, I’m going to turn my camera and my mic off and let him get right into it.
Mikael: Let’s explain what we’re going to talk about in this webinar. So, Kubernetes has become a really good system to build your applications upon. But it can be hard to troubleshoot. And we’re going to talk about 5 best practices to simplify this process.
First, who am I? My name is Mikael. And in the last 5 years, I’ve worked extensively with Kubernetes, both managing, troubleshooting, and learning about it. And today I’m a DevOps engineer at Komodor, where I started building the first Kubernetes native troubleshooting platform. I am a self-taught developer and learned DevOps along the way. I’m passionate about automation and Kubernetes. And I think that working smarter and not harder is a really good way to make your work more enjoyable. And we’re going to talk about it today.
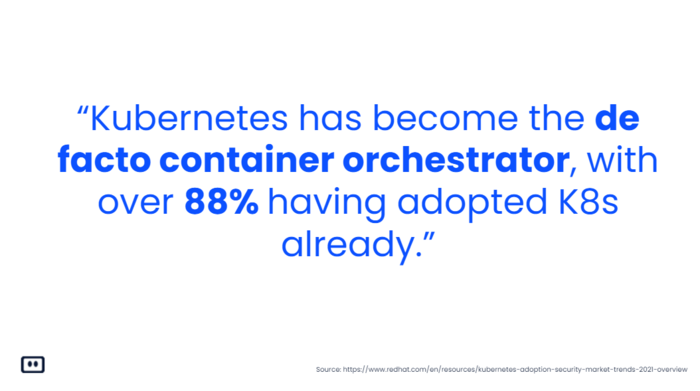
So, even before I started to work with Kubernetes, it has become the most popular container orchestrating system. And today, Kubernetes is eating the world. In the old days, I used to deploy services on virtual machines. It required scripts, a lot of maintenance, and knowledge of what you’re doing. A lot of the applications were monolith, meaning they’re very big, both in terms of how much code there was, but also in terms of how much infrastructure and like knowledge was required for them. Very quickly, I think the development community started adopting microservices, and splitting the work into more manageable parts. But it brought something new to the table. And it’s having the need to maintain a bigger number of applications with that. So, I think with the move to containers, Kubernetes was born to orchestrate it all together, bringing a lot of benefits to the table. And let’s talk about this. First is the flexibility of development and scaling. I think once you know what you’re doing, it’s very easy to deploy a new application and scale it to amazing loads using Kubernetes. All major cloud providers today bring you a very easy way to spin up a Kubernetes cluster, a lot more easily than if you were to do it yourself on a basic virtual machine. Developers walk a lot faster, and they think less about the deployment phase of, “Okay, I wrote and built this application. What do I need to do now to actually make it available to my customers?”
Kubernetes is a very sturdy and reliable orchestration system. And you can see a lot of big enterprises and companies working with Kubernetes, handling amazing loads and doing all kinds of things with it. And it has been there for a few years now. And you can really see that it held up properly.
About cost savings, I think in the long run, Kubernetes is more cost-effective if you know what you’re doing. Meaning that the base cost of Kubernetes, having a cluster of Kubernetes, is probably a bit higher than just pinning up any virtual machine and deploying an application on it. The moment that you’re going to need to have 100, 200, maybe 1000 different services and applications or multiple replica environments and managing other configurations, it can be more cost-effective for you to have 1 system or 1 platform. Orchestrating it all together, rather than spending your time and money getting all your teams to use, like 5 or 10 different services to manage all of that.
So, there’s a lot of really great reasons why you should use Kubernetes. This brings us to the darker parts of Kubernetes, why it might not be so great. So, I think some challenges that Kubernetes brings with the awesomeness of it, first of all, is authorization permission management of services. Also, clients, developers, machines, everything need access to do something on Kubernetes. Even inside itself, services that need to talk with other services – are they allowed? What if they’re in a different namespace or different cluster? And it can become a bit more challenging to do it in Kubernetes.
You also need to report certain quality of observability data, such as logs, alerts, traces, and metrics. And since it’s so easy to scale up Kubernetes to the sky and have hundreds of services and replicas, it also brings a big challenge on how to manage a good observability stack on top of that. I think next would be probably some changes into development. Adjusting your team processes to adapt the way Kubernetes works in regards of deployments, management, and troubleshooting of the applications on Kubernetes. And all of these challenges can definitely be grouped into 1 word, complexity.
So, now that we understand that Kubernetes is complex, the more interesting part is understanding why it’s complex. But I think I’m not the only one to say that. There’s a lot of people using Kubernetes nowadays that say themselves. For example, Drew Bradstock, Product lead for GKE, the Kubernetes engine on Google. And Kubernetes was born as a project of Google for the internal use, and later on brought as an open-source platform for people to enjoy. But if somebody like that is saying that Kubernetes is complex to use, then there’s no arguing with that.
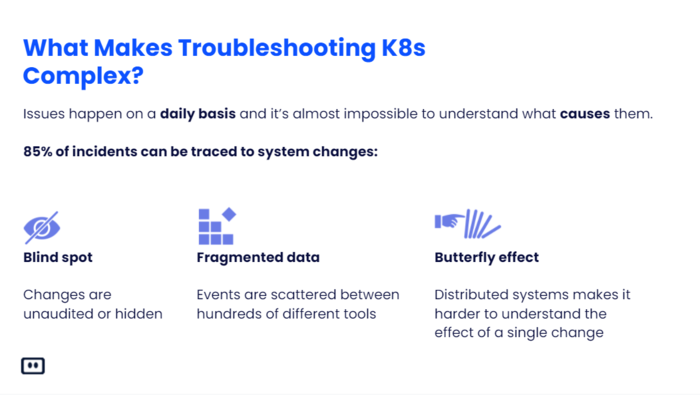
So, let’s talk a bit about why troubleshooting Kubernetes is a bit more difficult than other places. From experience, I can say that incidents and issues can happen on a daily basis, if not more frequently. It’s almost impossible to understand what causes these incidents, or at least the root cause of it, which is the important thing. A good majority of incidents can be traced to system changes, understanding exactly what changed in the last 5 minutes in the last hour, that caused my system to go down, or to be partially available. Sometimes changes can be done by people unknowingly, in a manner that wasn’t the right one. For example, merging a pull request which was reviewed by somebody else that didn’t pass its tests and piecing everything together.
I can look at myself now at Komodor, and every time something happens, I have to open about 10 different platforms and services to see logs, metrics, alerts, and basically every change that happened in our system. And piecing it all together by understanding what is connected to what, who talks to who, what happened when, and doing it like in my head, or during a stressful time of an incident, is very hard.
So, then you’ve probably heard of the butterfly effect. It’s something that happened on distributed systems like Kubernetes that every time something changes, you cannot be 100% sure what are the effects. You can do the slightest, smallest change on anything. It might be a configuration. It might be a new version that you spin up. But it can affect all your other services, and you wouldn’t even know it.
Now, these are changes, but I think that Kubernetes’ complexity also comes through in terms of knowledge and access. If you can think of your developer teams, probably not everybody is an expert in Kubernetes. Or even if not an expert, there are some people that never worked with Kubernetes and they just don’t know what it is or what they need to do to understand what’s going on.
And last, but not least, is the lack of access, as I said. I think that most companies have some kind of compliance or security requirements, needing them to only grant access to certain systems and platforms for people that need it. But where can you put the line on who needs access to Kubernetes and who doesn’t? It’s very hard. And I think that, yes, people resolving incidents, or being on an on-call rotation probably need access to Kubernetes. But if they have access and they don’t have the knowledge to use Kubernetes, then we’ve gone nowhere.
And it’s kind of a tightrope act of understanding exactly the balance of how much access and how much knowledge people have. They really don’t need to be an expert with everything to understand how it works, but they need some kind of a basis to build upon and learn by themselves. So, all we can aim to do is to bridge the gap between the people who lack information, knowledge, usually developers, and the people who do, usually the Ops team or SRE team, which have more experience with Kubernetes.
But how can we solve this? I think by building a strong foundation, using the best practices that we’re going to talk about, is going to simplify the day-to-day troubleshooting process of Kubernetes in any company.
So, number 1, we have to maintain a good YAML hygiene. What does that mean? Kubernetes is based on YAML files being a description of what we want them to actually do in the cluster. For example, if I want to deploy a new application, I’m going to write a YAML file describing what Docker image I want to use, how many replicas of that service I want, which environment and configuration I want, and so on. But there’s a lot more things that you can add to this file to make your life easier when troubleshooting, all kinds of metadata, such as labels, annotations, environment variables that can make your life easier when trying to understand where an incident happened. So, you can choose to put your own version, which environment it is, some kind of business specific data, something that applies to your business information on these levels and rotations. And the 2 other things that are important is configuring the liveliness and readiness probe.
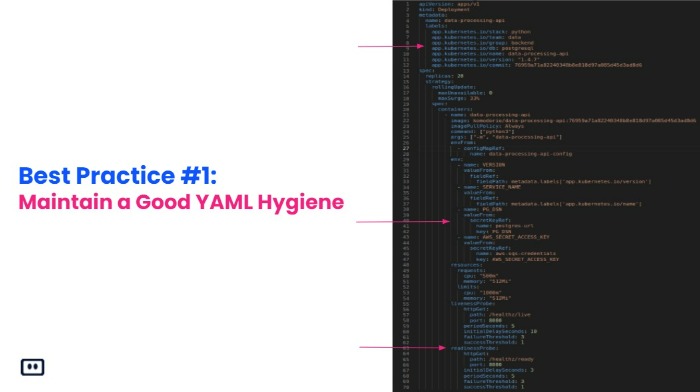
So, we can see an example here of a YAML file in Kubernetes. And if you can look at the labels, then we can see that everything is listed there. What language is it? What team uses this application? What database does it use, what version it is on, even the git commit. You can even use proper secret and config maps to map your environment variables in a better way so that if something doesn’t exist, or if something changes, then you’re going to have an easier time finding out what exactly changed, instead of just having plaintext and then variables configured.
Regarding the probes, I think it’s one of the most basic core concepts of Kubernetes, that if you configure it properly, it’s going to make it a lot more enjoyable to use Kubernetes. The liveness awareness probe actually tells your cluster, tells Kubernetes, if your service is, 1, ready to accept any request or traffic, and 2, if it’s now alive and can continue to receive those requests. And in case it doesn’t, then the probe will fail with Kubernetes, and Kubernetes will request your service to restart making it kind of refresh. That’s it.
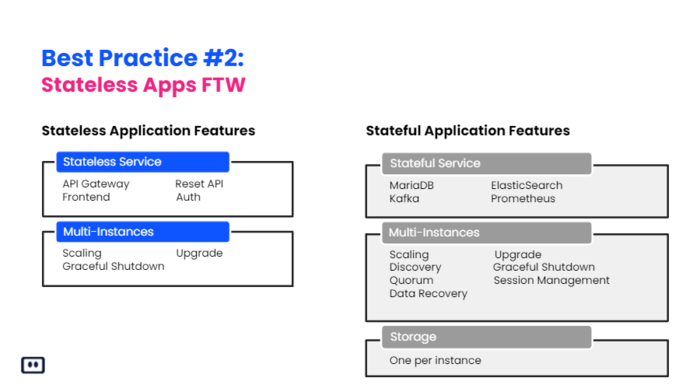
So, number 2, Kubernetes was built for stateless applications. It’s based upon the base premise that everything should be volatile and shouldn’t care about persistence. I think it’s a lot easier to write stateless application, because you don’t need to think about data corruption, or relying on persistent data being available for your pods to load. And when you’re building stateful applications, you’re going to always be in fear of, “Okay, what happens when I need to scale up my application and add 5 more replicas to that?” You’re going to think about, “Okay, I’m using some kind of persistence of volume, and I’m going to need to spin up new volumes for the pods to work with. I’m going to have to think about how does it affect my service that I now have, let’s say, 10 instances of it instead of 5? Can it handle that? Is it synchronized? Do I have the data that I need to even load my application correctly?” And billing status application is a lot easier. You just do what you need whenever you want. You can scale hundreds of replicas easily. And there’s just no fear of data corruption or any loss of data.
The next point is about logging, specifically for Kubernetes. You’re going to have logs in any application that you write. In Kubernetes, it changes a bit, because now you’re going to have to aggregate all your logs into one place to properly view them. And you’re going to have to tag them accordingly. Even if it’s as simple as just adding to your logs, what is the service that’s currently logging, the version of it, some information about the cluster, like which environment, what is the name of the cluster, on which node it’s running maybe? And, as always, some business-specific data. It can be the account that is currently related to this request. It can be anything that applies to you when troubleshooting.
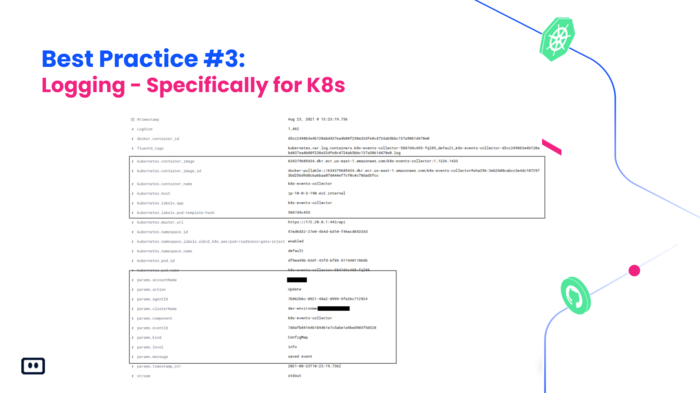
One actual example from Komodor, is that you can see we’ve added a lot of metadata to our logs that can tell us all kinds of information that Kubernetes, like the name of the container on which pod it is located on, what is the application, the exact Docker image it’s running. And a lot of applications about our application itself. Which account this event is currently being handled for, what is the auction that we’re looking for, some kind of ideas, the name of the service, and so on, and so on.
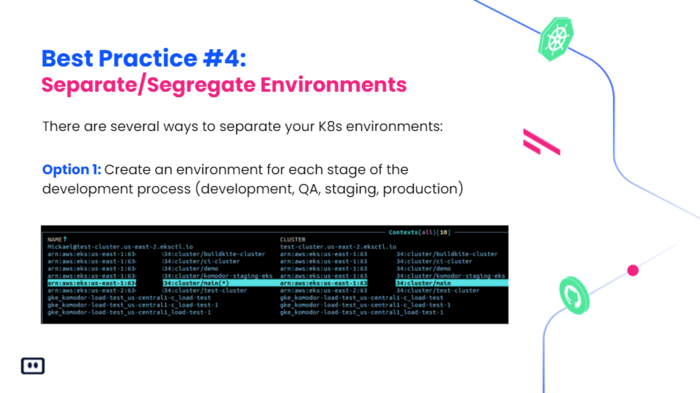
So, now that you have kind of baseline environments set up, you’re probably going to want to have multiple environments to work against. For example, you might have a development environment, a QA, staging, and production environment. And in Kubernetes, there’s a few ways that you can make that happen. The first one is going to be to create an environment for each stage of the process. And that can be an entirely different cluster. So, you can have 1 cluster for staging, 1 cluster for production, and everything separated, everything is different.
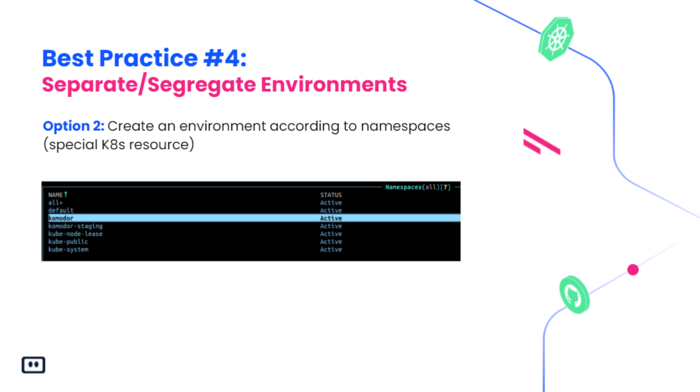
The second one is going to be to create a namespace for each environment. A namespace is actually a Kubernetes resource that just separates your applications into different sections of the cluster. And they are completely separated from one another. And you can use that to probably save some money when building.
Okay, so the last point is going to be proper monitoring. I think building on Kubernetes is easy to get started, especially in the cloud when you can have all these major cloud providers that make it easy for you to spin up a new cluster and start working on it. But when it comes to monitoring and troubleshooting your applications, there are a few options. One is to use and to choose an open-source monitoring solution, like Prometheus with Grafana. And the second one is going to be the commercial option of maybe using Datadog with New Relic or any other platform.
I think that using a commercial platform is definitely more expensive in terms of how much it costs them. have money. But the open-source solution isn’t that cheap in terms of how much time do people actually work on making it happen and making it look good.
A commercial solution might be easier to start with, because it gives you all kinds of integrations built into the service that you can use, and even has like starter dashboards with all kinds of data that you might want to see for using. And if you’re using Prometheus, for example, you’re going to have nothing, and you’re going to have to build everything from scratch. So, that means if you’re using an open-source monitoring solution, you’re definitely going to need to know what it is that you’re doing, and have a dedicated person or team managing all of that.
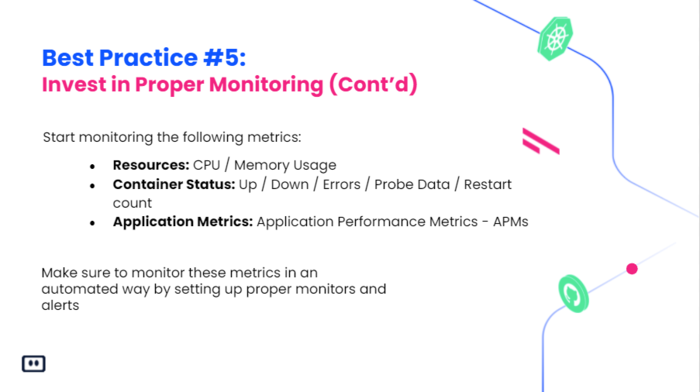
So, once we’ve chosen how we want to monitor, let’s talk about what exactly we want, or we need to monitor in order to make the troubleshooting process a bit easier on us. Of course, we can start monitoring everything from the start. But from experience again, I think that’s a very bad way to do it. There are some core metrics that you might want to start monitoring, like CPU and memory. It’s always the go-to to look at if something is behaving not as expected. And it’s very clear when something is not working properly. If you’re using more memory than you’ve allocated, then of course, something’s wrong and it’s not going to work.
Questions you should ask yourself are: how many probes are currently up versus down? How many errors are happening? Are the liveness pods returning properly, or are they crashing and restarting your pods every now and again? And if they’re starting a good metric to keep in mind is the restart count of your pods. If they restarted once or twice, maybe there was a spike in traffic and the pod made them restart. But if they restarted like 500 times in the last hour, I’m going to start thinking that there’s an issue with this application.
And last but not least, again, are your application performance metrics (APMs). It’s probably one of the most best ways to get as much context in your application as needed when troubleshooting. APMs give you everything that happens in your application. How much time did everything take? Who talked to whom? Which API calls did it make? What did it use? And if you have an exception on error, then it can give you the full stack trace exactly when it happened, and you can get some nice metrics about latency and rates.
Setting up your APMs is a lot of work, especially if you want to do it really, really good. By default, you will get a lot of data that is pretty valuable to start troubleshooting with. And one thing to keep in mind is that you always want to build upon what you already have. You don’t want to start planning from 0 how you’re going to get to 100. You want to start with something small, something that you understand, something that gives you maybe low value, that can help you understand, what exactly do you need? And from incident to incident, we’re going to improve upon and think about the things that you were missing the last time, making it evolve in terms of your monitoring stack.
The last step regarding proper monitoring is going to be to make sure that these metrics have proper monitoring that can alert you when you need. Whenever you have an alert that pops up, the first thing that you need to think of is, “Okay, what can I understand from this alert? Is it clear? Do I know exactly what’s happening? Does it make sense?” And if it doesn’t, you need to think about it again. Because noise can be your biggest enemy. The more alerts you have, the more noise you have, and it’s going to make troubleshooting your incidents much harder. And again, like the metrics, like the APMs, it’s something that you build upon. You start with something, and the next time it pops up, you can understand, “Okay, the threshold I put on this monitor is good, or it’s too low, or maybe it doesn’t give me enough information.” You can add some more context to the alert to help you troubleshoot. Like, for example, putting some links to dashboards and to your logging platform. If it’s something that’s commonly happening, then you can put some explanation of what is it so that the next person looking at this alert can understand more easily what exactly is happening.
So, when troubleshooting Kubernetes, you’re going to have a hard time, that’s the least we can say. But you can mitigate that by building the right foundations for your environments and for your team. And if you start doing it from the moment you step into the world of Kubernetes, it’s going to be a lot easier than having a fully-fledged environment already built on, and start changing the way that you work. Down the line, it will enable you and your team to move a lot faster, increase ownership of some people or teams that might not have had the opportunity or knowledge to work on troubleshooting Kubernetes. And that’s the end goal, to bring more value to your customers, to have your end users more happy because everything is working a lot better.
And that’s it. I’ll be more than happy to address questions from the audience. Thank you very much for the opportunity.
Sharon: Alright, great. Thank you so much. Mikael. That was amazing. Alright. So, let’s see. Yeah, we’ve got a whole bunch of great questions here from the audience. So, if you are ready, I’m just going to start throwing them your way.
Alright. So, first of all, here’s a good one, “When we have a Kubernetes issue, we’ve noticed that our developers who are the on call team have too many solutions to review and it takes them a lot of time and effort to determine root cause. Is there a solution that helps with providing better visibility and context to troubleshoot?”
Mikael: Yes, of course. So, to start, that’s exactly what we are developing today at Komodor. We provide a unified platform that acts as a one-stop troubleshooting solution in a way. We support auto-integration, just as GitHub, Datadog, other 3rd party apps and, of course, Kubernetes, which is the main focus of our platform. Komodor shows you a service map of all your applications in real time, and it allows you to see exactly what is happening inside your clusters, along with some insights on why these things are happening. That helps you basically troubleshoot and understand issues when they arise.
To answer the question specifically though, Komodor shows also a timeline of everything that’s happened in the environment from all third party services, from Kubernetes, from all your applications, making it a lot easier to come through all the information, seeing all the environments together, multiple clusters, all the third-party services that you’re using, monitoring, etc.
Sharon: Okay. Alright, here is another good one, “Komodor sounds interesting, but I don’t get what’s the difference exactly. Can’t I just use kubectl to determine root cause?”
Mikael: Yep. So, kubectl is merely a client to access the Kubernetes API. You can use it. You’ll get a lot of information, raw information. Maybe too much data, it becomes overwhelming for mainly people that are not familiar or working every day with Kubernetes. And the goal with Komodor is to bridge that gap to developers who don’t spend all day in Kubernetes and Kubernetes itself, or even to help them get to the same level as a SRE or Ops team who would understand the platform and application.
Sharon: Got it. That makes so much sense. Thank you.
Mikael: Yeah.
Sharon: Alright. We’re currently planning to migrate to Kubernetes. This is really useful as the foundation to keep in mind. But do you have any other tips we should be aware of before we beginning the migration?
Mikael: Yeah, of course. I have 3 tips that might help anyone that’s looking to migrate into Kubernetes from any other place. First is to understand that the migration will have to happen in chunks. I hardly believe that everything will go smoothly on the first drive, like anything that has to do with development. And you need to find the right application to start migrating. Probably a good idea is to find some internal applications or low traffic ones that can start being on Kubernetes. And you might be able to learn from them and make it better.
Second tip is going to be to understand your infrastructure requirements. For example, load balancers, permissions, configuration management etc. And the most important, as I said, knowledge sharing within the team. How can the personnel that works on these applications continue to maintain them as easily or even more easily than before?
And last tip I have for you guys is to review your CI/CD solution. Will it work with Kubernetes? Are your applications already dockerized? Or do we have to start by doing that? That might be the first step.
Sharon: Okay. That would be a good first step, I think, after that. Alright, here is one, “What are some Kubernetes automation activities that might be a good fit here?”
Mikael: One thing… I mean, there’s a lot of things that you can automate in Kubernetes. The most obvious one would be, for example, certificates, SSL certificates. You can use, for example, cert manager, which will manage all of that for you. And the second thing would be deployments. I don’t think it’s a good idea, especially in larger teams to deploy applications themselves. You’re going to lose the audit that goes with it. You’re never going to know what version is currently running for each service. So, you want some kind of pipeline that automates all that work.
Sharon: Okay. “And how do you maintain good YAML hygiene?” I know you had talked about that earlier, but tips for maintaining that?
Mikael: That’s a hard one. I don’t think I’ve encountered any tool that really makes life easier with keeping your YAMLs proper and clean. Of course, there are formatters that keep the structure of them properly. But for example, what we do at Komodor is we have some kind of script that checks our YAML, with requirements that we put in with specific policies of what needs to be in the YAML description file before it’s actually deployed. So, for us, it’s to have the right labels & annotations in place, and that all the environment variables use secrets, or config maps, and nothing remains in plain text.
Sharon: Right. Okay, folks, oh, let’s see. If you’ve got any more questions for us, please, now is the time. Get those in there. Otherwise, it is just about time for us to draw the winners for our Amazon gift card drawing. So, the moment you’ve all been waiting for. Alright, our first winner today is Alonzo P. Congratulations, Alonzo. Next, Geeta S. Congratulations to you. Tom T. is our third winner today. And our fourth amazon gift card winner is Manu S. Congratulations to all our Amazon gift card winners. We will be sending you an email with instructions for claiming your gift cards. So, keep an eye on your inbox for that. And if you don’t see it there, please make sure and check your spam folders.
As another reminder to the audience, the session has been recorded. So, if you miss any or all of it, you’ll be able to go back and watch it again. We’ll be sending all of you an email with instructions for accessing the presentation and the webinar on demand. So, keep an eye out for that as well. Alright, well, thank you so very much, Mikael. That was an awesome presentation and some great questions for the audience. We really appreciate everyone’s time. Thanks so much for tuning in today, and we hope to see you again soon at another webinar. With that, I am Sharon Florentine, signing off.
Mikael: Thanks, Sharon.