- Home
- Resource library
- Webinars
- Observability and Resilience in Microservice Environments w/ Epsagon
Observability and Resilience in Microservice Environments w/ Epsagon

Itiel Shwartz
Co-Founding CTO @Komodor

Chinmay Gaikwad
Tech Evangelist, @Epsagon
Kubernetes has made it easier to manage and scale microservices. However, keeping track of so many moving parts is often challenging for Dev & Ops teams. A straightforward process like figuring out what changes were made to the system, and by whom, becomes mission impossible. Achieving clear observability for better monitoring and troubleshooting is key to improving the development process.
Itiel: Hey everyone, I’m Itiel; I’m the CTO of Komodor. And I’m going to talk to you today about tracking changes in distributed systems and the dark side of changes. So who am I? I’m the CTO and co-founder of Komodor, a startup building the first Kubernetes-native troubleshooting platform.
I’m a really big believer in DEV empowerment, and basically moving fast and ‘shift-left’ movement. In my previous work, I worked for eBay, Forter, and Rookout. I have quite a lot of back-end and infra-related experience. Also, I’m a really big Kubernetes fan.
So the agenda for today’s meeting, so first of all, I’m going to talk to you about why should you care about changes and what changed in your environment. Then I’m going to try and narrow down to what changes I mean and what changes are super risky in today’s modern environments.
Later, I’m going to talk about why it is so hard to find out what changed in your system. We’re going to talk about the future of tracking changes. Lastly, I’m going to try to give you a few helpful tips on how you can reduce the pain of basically tracking your changes in today’s modern systems.
So first of all, why should you care about changes? We talked a little bit about tracing ,and like, the cost of downtime and microservices. so I don’t think that I’m saying something new to anyone here, but issues happen on an hourly basis, for some companies; it can be even per minute.
And when I say issues, you derive from complete system downtime to small issues in your staging or like a bug or anything else. 85% of all incidents can be traced to a system change, and that means that someone, somewhere, in the organization changed something, and now your application is having problems.
I will say that most troubleshooting time is focused around that particular area, of finding out what’s the root cause. What happened in your system that might explain the symptoms that you’re currently experiencing. And those symptoms can, like I said, can be like a complete downtime or a bug in your U.I. Okay, so I keep saying changes, but when I’m saying changes, what do I really mean?
So this talk specifically is going to be more around the system-wide changes. So when I say changes and system changes, what do I really mean? I mean things like code deployment, which is like the first thing that come to mind. But also Infra changes, to think about changing the security group on AWS.
Configuration changes, feature flags with two slides, launch darkly, and split I.O. Job changes in Jenkins or in ArgoCD or in any other like job platform. D.B. migration, third-party changes. In this lecture, in particular, I’m not going to talk about like different usage or like data changes.
So sometimes, your application is experiencing downtime because something in the user behavior changed. Maybe they sent the other kind of data or a big load on your system. But in this talk, I’m not going to zoom in on those issues. Like I said like most changes are originated from like system changes, and not those kind of changes.
Okay, so I hope I’ve convinced you, and maybe you already know that like changes are important. When you try to solve an issue, you’re a detective, and basically, you try to figure out what changes can explain, like the problem you are facing. So why is it so hard to find what changed in your system?
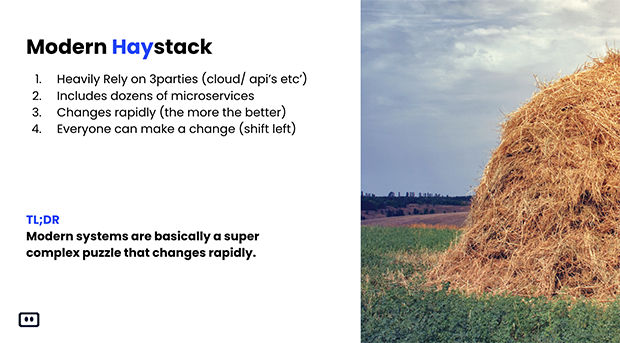
So today’s modern stack, or you can refer to it as like haystack, is very complex, and Chinmay said it like perfectly. It includes a lot of third parties services such as Xero, your cloud providers, and dozens of different rest APIs that your application is basically dependent upon for running correctly.
More than that, we took like the huge monolith that we had in the old days, and we broke it into Lambdas, into Kubernetes, into a dozen, a hundred or even thousands of small microservices that are running around. More than that, the change frequency has changed dramatically, and organizations, like modern good organizations, today can deploy to production hundreds or even thousands of times a day.
I’m only talking about like code changes, but like we already saw on the previous slide, there are a lot of changes that are not really considered like a deployment. Even if they can destroy your entire system, and this is like configuration change, future flags, and so on. I will say that if in the old days, like the one who deployed to production was usually some I.T. guy or an Ops guy.
So in today’s modern system, it can be the developer that is deploying to production. It can be even the product manager that is now toggling on and off the feature flag that impacts the customers. I will say that like trying to understand what changed in today’s modern system is basically like trying to look at a very complex puzzle that keeps on changing and figuring out what it looked like five minutes ago.
I tried to do, like to zoom in on like the three pillars that make troubleshooting so hard. So everything is connected, and again like Epsagon does a great job on like distributed tracing because everything is connected, and a change in one microservices can affect a lot of different microservices that are not even related.
Maybe it’s not even a first degree of connection, but the second, third, or even fourth degree of connection. And one change can have a ripple effect on your entire system. More than that, a lot of the changes today are done in tools that simply don’t have any audio clocks or the audio clocks are really hard to come across.
And AWS is a great example for this. So every time you change something in the AWS console, so basically, there are some cloud tray logs that audit here. But like almost no one uses them because it’s so complex to use them. And a lot of the other changes, like changing directly to production, are simply unaudited in any other form or way.
The last thing is even if all the changes were audited, and even if you have like, Epsagon which is a great tool to understand the connection. In order to understand really what changed, you need to open dozens of different tools to track down the change in each one of those different tools.
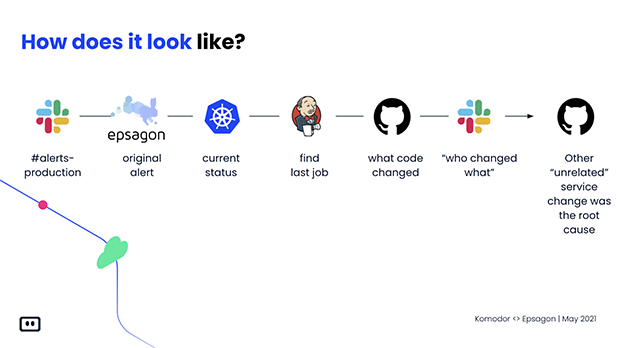
You need the expertise; you need the knowledge to open all of these different tools and to troubleshoot efficiently. I want to give like a very short glimpse on how like troubleshooting looks like in today’s modern system. So you get the alert from the slack, and you go to Epsagon, that shouted at you, that you have a problem in your system.
You go to Kubernetes trying to figure out what the hell changed here. And from Kubernetes, you go to your CICD pipeline to understand who deployed to production. Why? When? And you go to Jenkins; from Jenkins, you try to track down the source code. Over at GitHub, you go to GitHub, you’ve tried to understand if there’s any relevant commit in there, and you say Nah, I just can’t understand.
You ask on your team like who changed what? Why? And who can help me resolve the issue that I’m currently facing? In the end, basically, you understand that some other unrelated service was the root cause for all of these, and you simply missed the connection and simply missed the change in this unrelated GitHub deployment or change.
So now let’s talk about like the future, so is it going to get better? And like TLDR now, it’s not going to get better. All indicators are pointing out that things are only going to get a lot worse from now on.
The velocity is ever-growing, like even like small companies today, like deploy dozens of times a day to production every day. And with the shift-left movement, the DEV team can deploy, the product manager can change things. The Q&A, the Q.A…even they can now do risky changes to your production environment, and those trends are not going away anytime soon.
And the systems are becoming much more complex because it’s so easy to go in a microservice in today’s modern stack. Then basically like everything is smaller and smaller and smaller, like from microservices to Nano services and whatever. And things are only going to get a lot more complex and a lot more distributed.
So the trend that we are seeing now will make it even harder to understand what changes in my system can explain the symptoms that I’m currently experiencing. Okay, so I know like everything sounds bad, but there are a lot of good things that you can do in order to mitigate those risks.
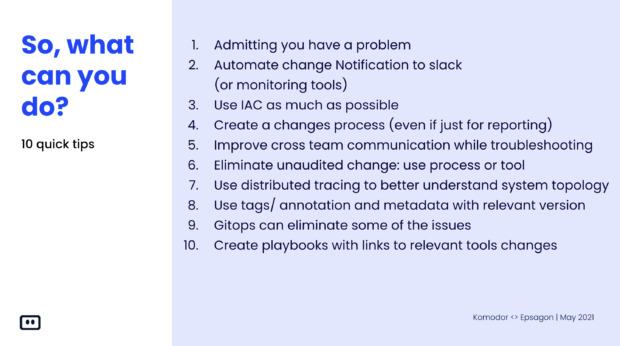
So the first thing you need to do is, like every, I’m not going to go over like, the ten like pillars of quick tips on how you can reduce the risk. But I will say that the important thing is to have the changes audited, and it can be automatically or by like using a process and just saying people write it down. But without that, troubleshooting is only going to get a lot more complex.
I will give like a selfish plugin, and before I’m going to be showing, Komodor. Troubleshooting can be easy. Komodor’s mission is basically to help developers and DevOps to make life easier for Dev and DevOps people.
Tracking changes and solving issues, and I’m going to go now to do a very live demo on like troubleshooting, a real incident in Komodor, so stay with me.
Itiel: So this is Komodor; this is our platform. I’m currently looking at a demo account that has basically two services. The screen that you’re currently viewing is Komodor service explorer. And this includes all of the services the customer is currently running, on top of all of the cluster, all of the namespace, and so on.
So for this like demo customer, it has only two services running inside this Kubernetes system. This is the rest API and the data processor. Komodor, in a high level, what we do, is we sit on top of your Kubernetes cluster, and we can map all of the services that are running in your like cross-environment and cross-cluster.
For each service, we build a full timeline that includes everything that changed and all of the impact and alerts that happen for this specific service. And we make the troubleshooting process, instead of like a very complex and cumbersome process, a very easy and streamlined process.
So in this use case, I can see that one of my services is unhealthy, which is bad. The data processor, it sounds important, so I’m going to jump right into these microservices. This is the Komodor service view. You can see a full timeline of everything that happened for this particular service.
On the left, we have some metadata regarding the service, and we can see that it’s unhealthy, even it has like 10 out of 10 replicas. We can see that in the middle, everything that changed for these microservices in the last 24 hours. So I can see that there was a deployment, and around like 10 hours later, there was some sort of like data dog monitoring, data dog alert, and some health issues in this service.
Which is quite bad, right? I’m going to try to zoom in and try to understand if I can see something. But for this microservice, that is currently experiencing issues, I can’t see anything that can explain the root cause.
I know that there was a deployment, but it happened like 10 hours ago, so I’m not sure if it’s related. Luckily for me, Komodor allowed me to see connection and changes across different tools and across different microservices. So basically, I have here the rest API, which is another service that runs on the same namespace.
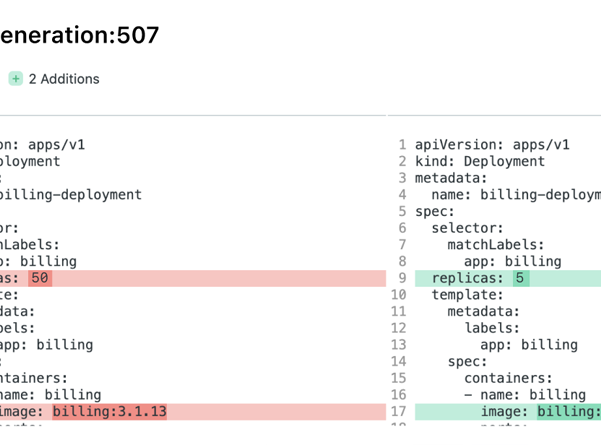
And I can view everything that changed both in the rest API and in the data processor. I can see very neatly that there was a deployment just before the data processor had an issue. So let’s click on the deploy event, and I can see in Komodor, you can see exactly what changed for each deployment.
You can see what changed both from the Kubernetes perspective, what has changed. And also, on the GitHub side, basically, what code changed inside GitHub. In this use case, I can see very clearly that the replicas changed from 50 replicas to 5 replicas. And this can very much explain the issue and the symptoms that I’m currently experiencing.
So here was a very like brief and short example of how Komodor allows me to understand what changed for my services. How is it currently behaving, if it’s healthy or not. And once the service became unhealthy, to simply understand what changes might explain the symptoms or issues that I’m currently experiencing.
So I want to leave some time for Q&A, so I’ll make it short, and let’s jump right into the Q&A session, and yes, Udi, take it from here.
Udi: Yes. So we have a few questions lined up. I think I’ll give the first one to Chinmay, and then we’ll get back to you, Itiel, because the other questions seem to be centered around Komodor.
So Chinmay, How can Epsagon and Komodor work together?
Chinmay: Yes. So as Itiel pointed out, that Epsagon does a great job of figuring out what’s going on in your system. And then, it essentially helps you pinpoint two different microservices that might be involved.
And then the Komodor integration can help you track the changes between the different versions of microservices, and I think like it’s a ‘better together’ story in a true sense.
Udi: Itiel, can you see the questions?
Itiel: Yes, I can see the questions. And I’ll try to answer some of them. So the question was can you share a little more details about the Komodor integration option? So Komodor installs a very simple agent on top of your Kubernetes cluster.
We support all of the Kubernetes distribution, both on-prem or on cloud. And we track down everything they change inside the Kubernetes cluster, and that means deployment, health events, changes on like HPA, and you name it we track it, and we take this data, and we show it up very neatly for our customers.
So basically, it’s a very like one-minute installation process, and you are covered regarding your Kubernetes cluster changes. So this is regarding the Kubernetes, Komodor integration options. I will say another question like why do I need a troubleshooting tool?
So I think both Chinmay and me tried to understand like the value of troubleshooting fast in today’s modern systems. And more than that, I think that because of the ‘shift-left’ movement, empowering the DEV to troubleshoot will help solve huge bottlenecks that are happening in today’s modern systems.
So this is like regarding the second question. Yes, any more question here? Does Komodor track alerts in addition to changes? So yes, we track changes, both for tools such as Epsagon, but also from other tools such as Ops Genie, Pager, Duty, Datadog, New Relic. We try to integrate with all of the modern auditing solution.
So we can give a full visibility over any alerting in your system. And yes, so does Komodor supports multiple clusters? Yes, we support multiple clusters. Multiple environment, hybrid environment, and so on.
Udi: Elad is asking does Komodor support feature flag changes?
Itiel: Yes, I’m happy and proud to say that we support feature flags and Launch Darkly, and we also have rest API to send like custom changes.


