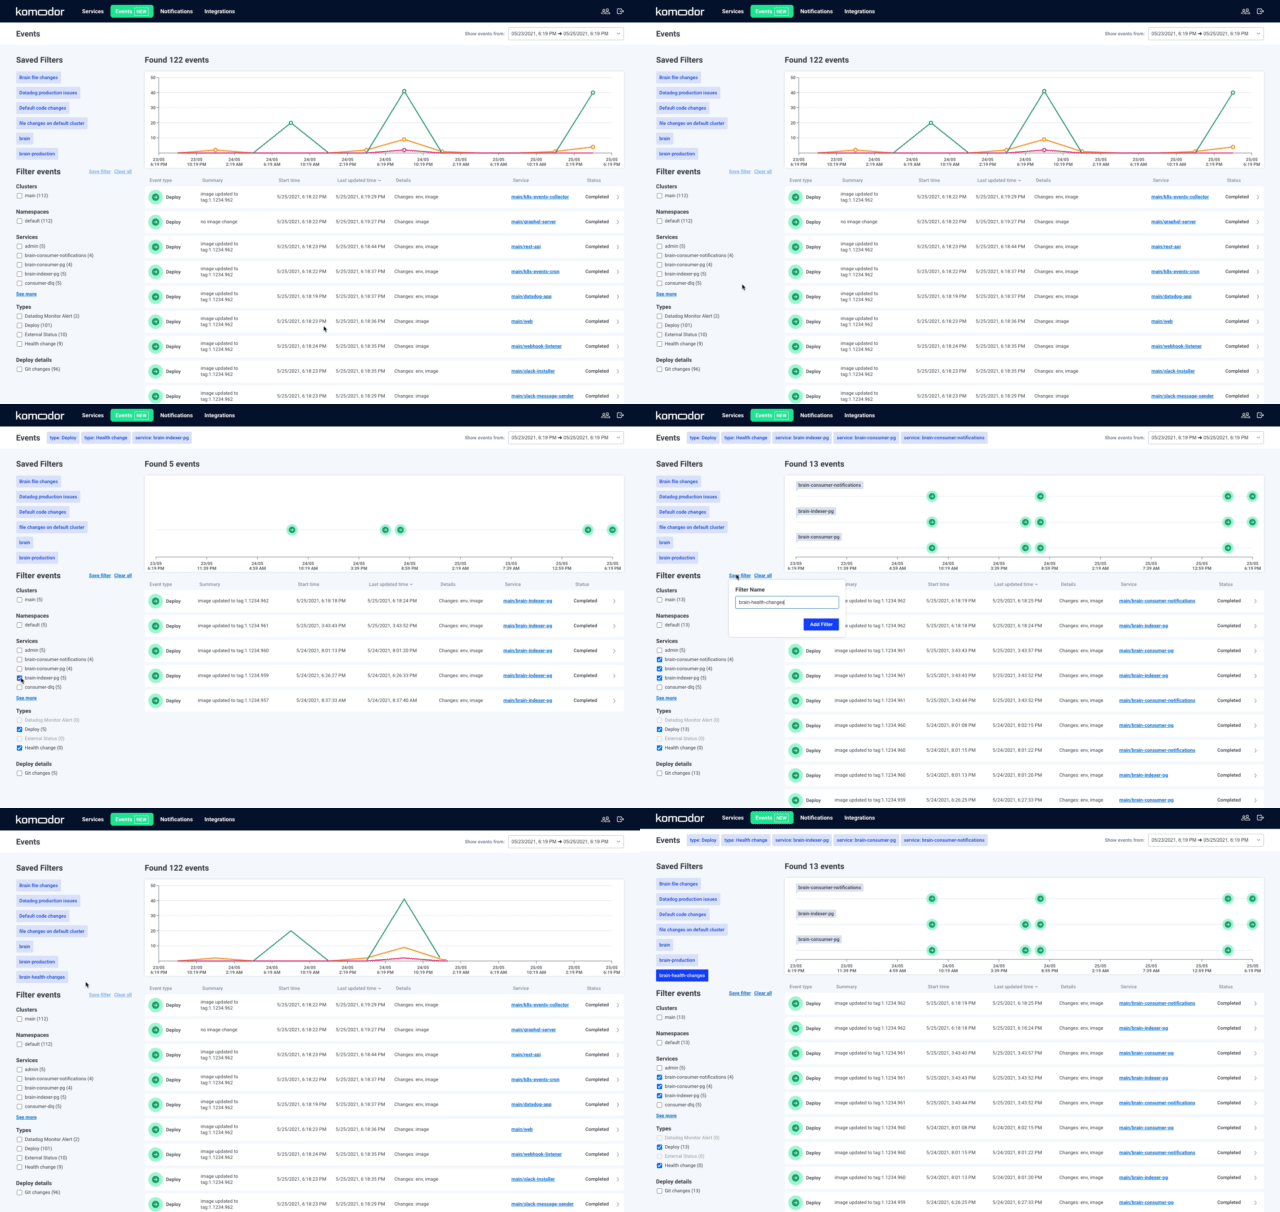
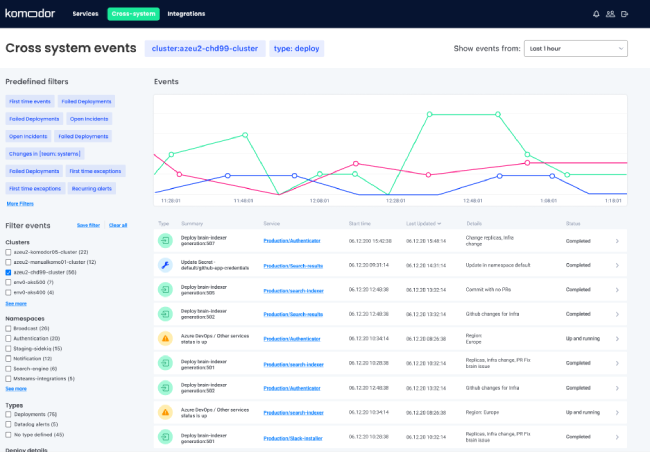
Today we are rolling out our new ‘Events’ feature that offers a panoramic view of all occurrences across your entire K8s environment. With this system-wide visibility, Komodor Events makes it easier to troubleshoot elusive issues, particularly those that aren’t traced to any one specific service or cluster.
The feature is available for all Komodor users.
Log in now to see it in action.
With ‘Events’ you get:
- A system-wide view of all events including health changes, alerts, code deployments, infra modifications, config updates, 3rd party services, etc.
- Customizable views you can create and share with teammates to promote collaborative investigations, ensuring that everyone is on the same page.
- Much needed visibility into the more “transparent” and often overlooked events, like slowness in the system, short-lived outages caused by 3rd party services and more. Awareness of these events can be helpful for troubleshooting user-reported issues that don’t trace to any of your preset alerts.
And that’s not all.
From our own experience with the feature, as well as feedback from our first users, we found out that using ‘Events’ came with another interesting and unexpected side benefit.
It seems that just spending time with the view helped the users to better familiarize themselves with the many moving parts of their K8s environments.
This surfaced again and again as we were taking notes from customer sessions, a sense of surprise followed by “I didn’t know that we had that…” or “I completely forgot about this…” or – that one time – just a big loud “OHHHH!” that pretty much said it all.
To Spot a Butterfly
Like so many other Komodor features, ‘Events’ was born out of the convergence of customer feedback and our own experiences with K8s troubleshooting.
In this case, the road to ‘Events’ started with a feature request from a customer, asking to have a unified view of all services, because – to slightly paraphrase – “We just don’t always know where to start looking”.
What he meant by that, and what we knew to be true ourselves, is that K8s issues often take the form of a “butterfly effect” where a minor hiccup in one service can manifest itself as a crushing issue in another.
Serendipitously (but not surprisingly), just a few days later, we found ourselves dealing with one such ripple effect ourselves when we spotted a sudden slowness in our web client – a slowness that couldn’t be explained by any of the client’s own code changes.
Not having a clear starting point for his investigation, our on-call dev ended up spending hours combing through deployment logs and DataDog screens before he was able to trace back the problem to a recently modified query that was pulling information about the current pod status in the background.
The query itself was not part of the web client’s service but it ended up impacting its performance all the same, because – following the change – it scaled up the number of requests and was suddenly overloading the same DB that we used to populate graphs in our web client.
With this experience still fresh in our mind we started working on a view that would help accelerate the investigation of such incidents by correlating changes across the entire system, and not only on a service level.
For that, however, we needed to rethink the way we visualized data in our platform. First and foremost, this meant that we had to learn to live without bars.
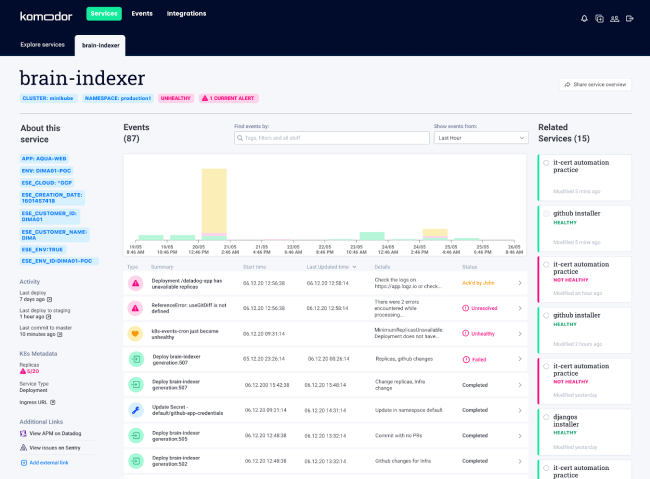
Yes, the bars… Love them or hate them, they were a big part of the Komodor dashboard for a while, serving as a visual element of choice to describe multiple events occurring over the same time frame. They worked well for showing sheer volumes, but when it came to describing timed correlations we knew that they would be falling short.
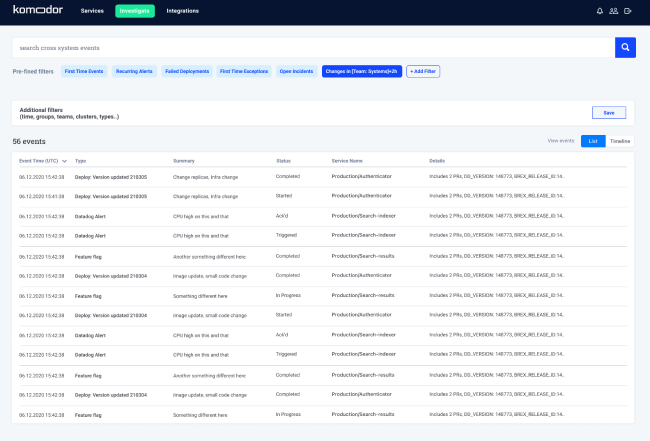
Clearly what we needed here was a timeline. And so we embarked on a quest, prototyping several different experiences, ranging from very detailed and search-driven…
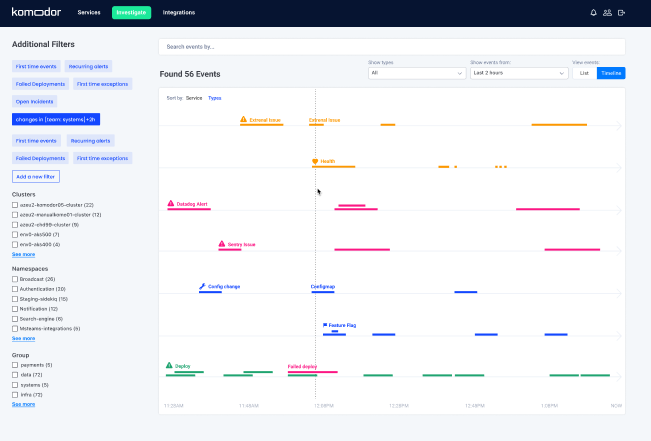
…to the extremely visual.
After several iterations, we ended up with a view that struck the right balance between being visually informative and actionable. With it, correlating between cross-system events was no longer a chore. So when the next tornado hits, it will be that much easier to spot the butterfly.
Want to experience ‘Events’ yourself? Just log into your Komodor account and if you are not a user yet, reach out, schedule a free trial and stop missing out.
